We are working on a new Splash Page Analytics which replaces the current Start Page Conversions Report.
It’s like google analytics for your splash pages and offers tons of new functionality. Here are the core functions:
- Interactive charts in Javascript / HTML5 format
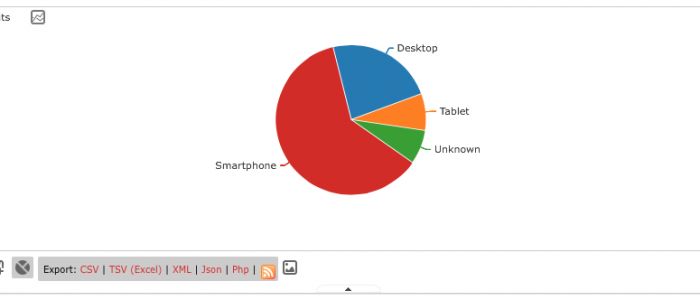
- Can be generated for each location in 4 categories: User Visits, Engagements, Devices, Goals (Successful Logins, Purchases)
- Can be viewed in different formats (simple table, detailed table, bar / pie / cloud charts)
- Can be exported in different formats (csv, excel, xml, json, php, rss)
- Can saved as an image
- Can be embedded to your own site
Charts (Data Visualization)
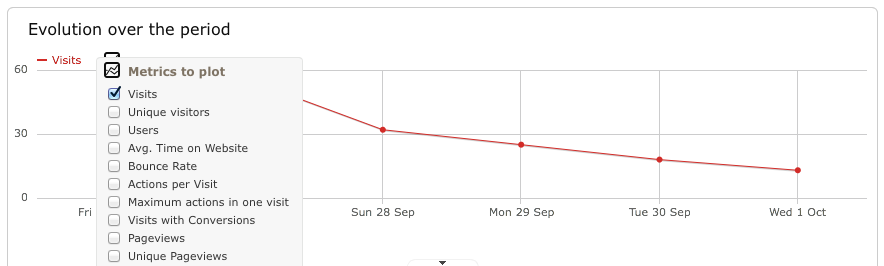
In a given report, there are often several metrics that are relevant (visits, page views, bounce rate, conversions, revenue, time on site, etc.). By default, graphs will show the historical evolution of a given metric. You can also choose to plot on the graph a different metric to the default one:
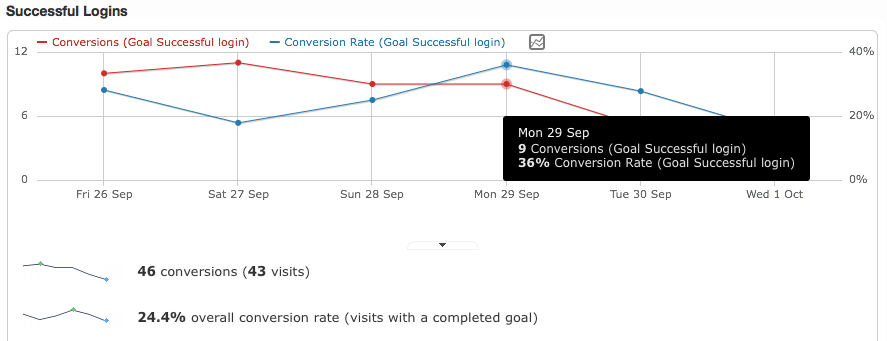
You can also plot several metrics at once, for example here we compare the number of successful logins and the conversion rate:
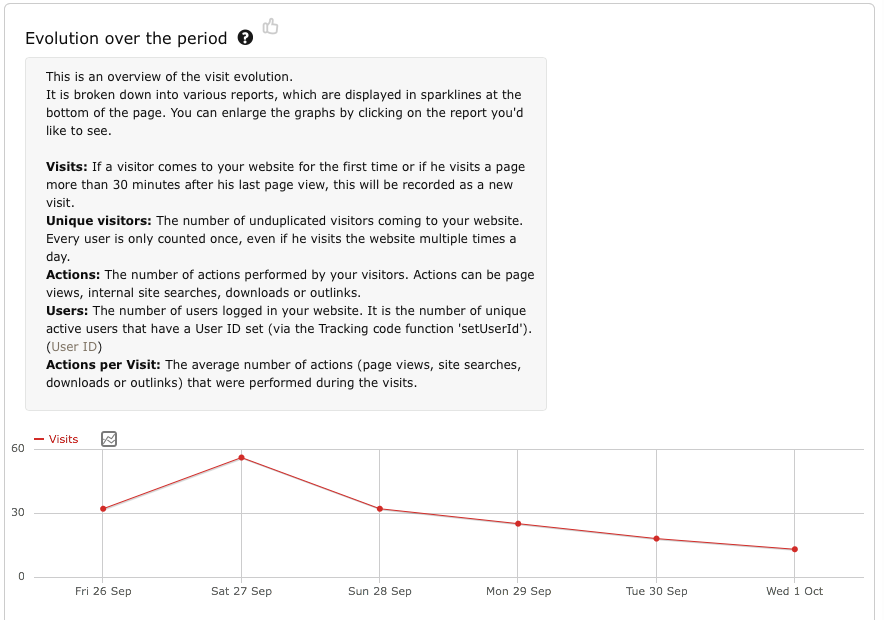
Inline help
When a report title is hovered, a Help icon appears which will display a short description of the current report.
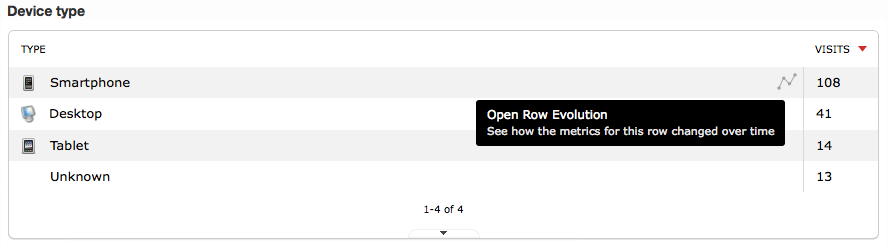
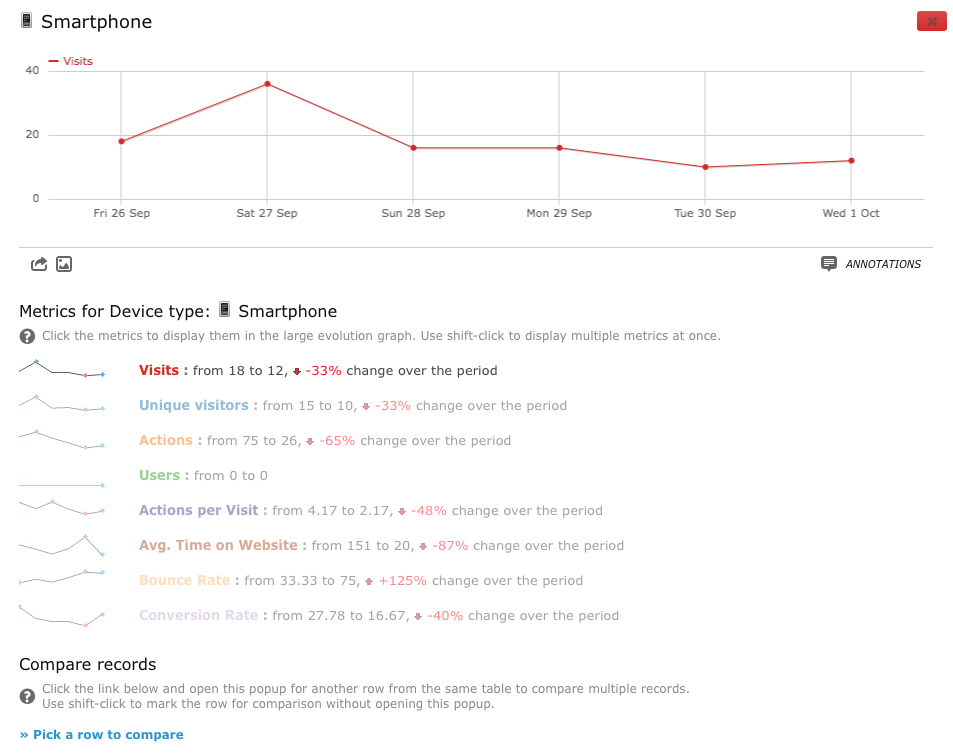
Detailed historical report about any data point
There is a very useful feature which we call “Row Evolution”. You can hover the mouse on any row, click on the little graph icon, and it will open a detailed view of the historical values for this specific row:
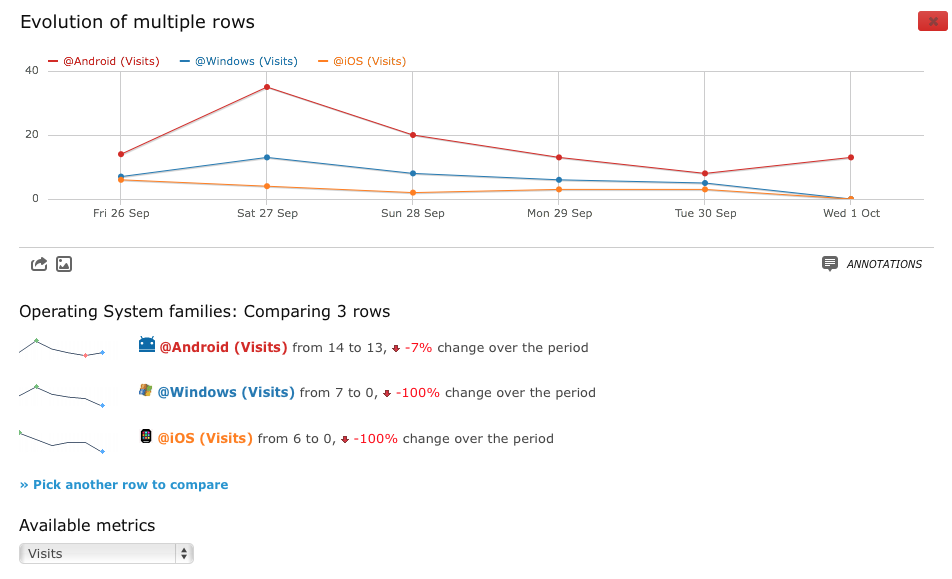
You can also compare several rows together, for example to compare the Mobile devices used:
NOTE: If you are using a custom skin and edited footer.inc.html, be sure that you add {TRACKING_CODE} tag before the </body> tag in this template.
Happy to see that you are adding new cool features
Hello,
We have a large network of devices that 55+ that use hotspot system for splash pages. I’m interested in participating. when will this start?
Please contact us here so our support team can help you: http://help.hotspotsystem.com/contact-us
Hi Roland, when do you think this new feature will be available ? We are really interested in using it as this new features will help us to provide better service and offer value to the whole process. We are set as operator DIVERSA.
Thanks and regards,
I would like to try the new splash page, is possible?
You have been added, however you need to have Basic Plus for this feature.
I would like to be a part of the private Splash Page Beta.
You have been added. You can check the new report under Reports > TRAFFIC AND CONVERSION REPORT.
Hi there
I would like to test this new feature.
Rafael Franco
You have been added. You can check the new report under Reports > TRAFFIC AND CONVERSION REPORT.
I’d like to use this feature as well!
You have been added, however you will only see the locations with basic plus subscriptions under Reports > TRAFFIC AND CONVERSION REPORT.
Please add me test this new feature. Thanks
Thanks Roland, I’ve just cheched that we are already added.